Car-free cities and pedestrian apartheid
Car-free cities and pedestrian apartheid
#PedestrianApartheid

Car Trouble: And How to Fix It from Carfree Cities on Vimeo.
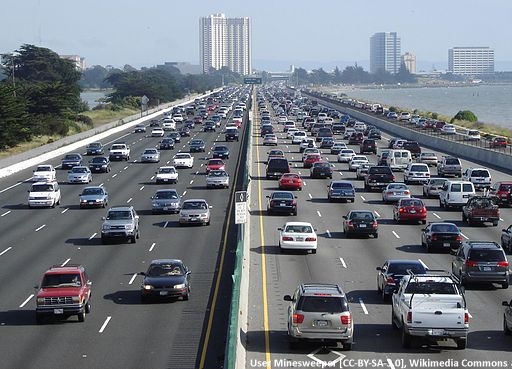
Mixing motorists and non-motorists.
continue reading…
#PedestrianApartheid

Car Trouble: And How to Fix It from Carfree Cities on Vimeo.
continue reading…
#CarbonBudgetMorality

The War on Evil
The Carbon Budget Morality Index (CBMI) is an attempt to link the your effects on climate change with a score estimating your morality – so you can see how evil you are.
continue reading…
#LargeScaleLabourSubsidies
This outlines an old proposal of mine to modify VAT to create jobs.
The proposal gives extra flexibility to the management of the economy, making it easier to achieve full employment.
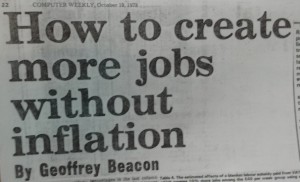
Below are two pieces I had published in the Computer Weekly in 1978. The first is an introduction from something that got rather technical and the second more concise description of the proposal I have been putting forward since the early 1970s.
Computer Weekly, October 1978

continue reading…
#MixedCommunities
The “mixed communities” paradigm for housing development aimed to mix poorer people with more affluent neighbours to avoid the problems of large sink estates. It has been central to housing policy for more than a decade. A Parliamentary Select Committee in 2003 reported:
90. Several witnesses drew attention to the mistakes of the 1950s and 1960s when large council estates were built which tended to include high concentrations of poorer households. In its new programme, the Government must avoid creating ghettos by ensuring that different tenures are integrated into new developments. New approaches are required by private developers and housing associations to create mixed tenure schemes.

During the 1980s many council estates declined. The rot really set in with Thatcher’s housing policy as Andy Beckett outlined in a Guardian article, The right to buy: the housing crisis that Thatcher built:
continue reading…

Hazebrouck before the car
In 1976, I wrote a note, “RSPCA News”, about developments for non-motorists, where they are separated from motorists. This outlined financial and legal mechanisms that could make non-motorist developments work.
continue reading…
.jpg)
Janesville Assembly Plant is a former automobile factory owned by General Motors located in Janesville, Wisconsin. Opened in 1919, it was the oldest operating GM plant when it was largely idled in December 2008, and ceased all remaining production on April 23, 2009.
Listening to the BBC World Service Business Daily programme on Tuesday morning that old angry amateur feeling came back. The programme, Jobs for the World’s Young, was billed like this:
Young people make up 35% of the world’s unemployed, and it’s a global problem. Pulitzer prize-winning reporter Amy Goldstein, author of Janesville: An American Story, tells us how retraining doesn’t always work when it comes to finding people new jobs in the rust belt of America.
In her review of Janesville in the New York Times, Jennifer Senior wrote
In the case of the many laid-off workers in the Janesville area, the outcomes are decidedly worse for those who have attended the local technical college to learn a new trade.
continue reading…
I hope readers will excuse the labourious details but even I find
the theme “The ODI censored me” rather far fetched.
I reported in a Angry Amateur No 2 that most of my websites are banned in Morrisons supermarkets. Most other websites are available even protest sites like Making Workers Pay or The Canary, a left wing site which The Sun has accused of spreading fake news. With most of my other sites blocked, this looks personal – but why? I am a bit paranoid but there are some out there that want to censor my views (and, of course, other more important views) but imagine my surprise when I discovered that the Overseas Development Institute seems to have joined in.

Although the ODI are a bit too close to the UK Government, they strike me as good people. They invite me to their presentations and have publications like these:
continue reading…

From Andrew Marvell’s most famous poem is To His Coy Mistress.
Had we but world enough and time,
This coyness, lady, were no crime.
We would sit down, and think which way
To walk, and pass our long love’s day.
But at my back I always hear
Time’s wingèd chariot hurrying near;
And yonder all before us lie
Deserts of vast eternity.
Thy beauty shall no more be found;
Nor, in thy marble vault, shall sound
My echoing song; then worms shall try
That long-preserved virginity
Let us roll all our strength and all
Our sweetness up into one ball,
And tear our pleasures with rough strife
Through the iron gates of life:
Thus, though we cannot make our sun
Stand still, yet we will make him run.
continue reading…
#CarbonBudgetMorality
I’ve tried to keep this post understandable.
For those that don’t like too many numbers, sorry.
Sometimes the small print is important.
I’ve been comparing the Global Carbon Project‘s Carbon Budgets for 2016 and 2015 and found two useful diagrams. Here are the diagrams, with a little bit of extra annotation to avoid the confusion that I had to start with.
Figure A: From Carbon Budget 2015: Heading “The total remaining emissions from 2014 to keep global average temperature below 2°C (900 GtCO2 ) will be used in around 20 years at current emission rates”.

Figure A:The remaining carbon quota for 66% chance <2°C : From the end of 2014
continue reading…
This is a re-post from DontLookNow.org
Representative concentration pathways (RCPs) are hypothetical emissions of greenhouse gasses and other climate pollutants. Representative concentration pathways (RCPs) are hypothetical emissions of greenhouse gasses and other climate pollutants. They are actually specified as atmospheric concentrations of greenhouse gasses but have been converted into tables of emissions by The Potsdam Institute.
The RCPs specify individual climate pollutants, such as CO2, CH4, N2O and black carbon for each year from 2000 until 2100. The RCPs were introduced in IPCC Assessment Report Five (AR5) in 2014. After a selection process four of these pathways – tables of numbers specifying the yearly emissions of each pollutant were chosen as representatives of possible future climate forcing over the century.
Four RCP’s were chosen as standard: RCP2.6, RCP4.5, RCP 6 and RCP8.5. RCP2.6 specifies the lowest concentrations of climate pollutants was specified in RCP2.6. According to climate models, RCP2.6 is the only RCP that keeps the rise in global average temperature since pre-industrial to below 2°C. The others have worse outcomes i.e. higher average global temperatures.
Different climate pollutants (like CO2, methane, N2O) have different warming and cooling effects on the Earth but the effects of these different pollutants are often combined into a figure that would equal the effect of carbon dioxide alone. This measure is called carbon dioxide equivalent or CO2e. Combining the effects of these different pollutants for the RCPs give this graph

According to Moss et al, The next generation of scenarios for climate change research and assessment, the global temperature changes in the years to 2100 are given by
Representative Concentration Pathway Temp anomaly °C RCP 2.6 1.5 – peak then decline RCP 4.5 2.4 – stabilisation without overshoot RCP 6 3.0 – stabilisation without overshoot RCP 8.4 4.9 – still rising by 2100
Figures taken from Skeptical Science
The United Nations Framework for Climate Change, describes the Paris Agreement of 2016 thus:
“The Paris Agreement’s central aim is to [ keep] a global temperature rise this century well below 2 degrees Celsius above pre-industrial levels and to pursue efforts to limit the temperature increase even further to 1.5 degrees Celsius.”
Since the Paris agreement there have been discussions as to a what temperature rise “above pre-industrial levels” means: e.g. What is the baseline? In the paper, Interpreting the Paris Agreement’s 1.5C temperature limit, Joeri Rogelj discusses natural variability:
“Therefore, we argue that the long-term temperature goal in the Paris Agreement should be understood as long-term changes in climatological averages attributed to human activity – excluding natural variability.”
In a further paper Emission budgets and pathways consistent with limiting warming to 1.5°C, Rogelj and others discuss the amount of greenhouse gases that can be emitted before the threshold of 1.5°C is reached. This paper has caused some controversy because it uses the HADCRUT measure of the temperature. This rates the global average temperature lower than other measures of temperature because it does not include temperatures in the Arctic, where temperatures are increasing rapidly.
(The quantity of greenhouse gases that can be emitted before a particular temperature is reached is called the remaining carbon budget, usually expressed as carbon dioxide equivalent.)
Criticism of this paper has come from one of the co-founders of Real Climate, Gavin Schmidt. Dr Schmidt is director of the NASA Goddard Institute for Space Studies. On his Twitter feed he said:
“Headline claim from carbon budget paper that warming is 0.9ºC from pre-I is unsupported. Using globally complete estimates ~1.2ºC (in 2015)”
Dr Richard Millar, is the lead author of the “Emissions budgets” paper is a post-doctoral research fellow at the Oxford Martin Net Zero Carbon Investment Initiative where Professor Myles Allen is co-director. Professor Allen is also one of the co-authors and one of the best known climate scientists in the UK. It may not be an inaccurate characterisation to call this a debate between Myles Allen and Gavin Schmidt.
Using the HADCRUT as the measure of global average temperature, the”Emissions budgets” paper reports a smaller rise in temperature since pre-industrial. This helps the conclusion that the world can emit more greenhouse gasses (has a larger carbon budget) before the 1.5°C limit is reached: More greenhouse gasses than other scientists have calculated using “globally complete” measures of average global temperature, such as GISTEMP from the NASA Goddard Institute for Space Sciences.
Perhaps we should note, whatever the difference between the HADCRUT and GISTEMP measures on this day in October 2017, the actual physical state of the Earth is unchanged. It is what it is, recent floods, droughts, hurricanes, wildfires and all.
The calculations for remaining carbon budgets are made using climate models.
Future physical states of the Earth are predicted by climate models. These are used to estimate remaining carbon budgets by counting emissions as global temperature changes. However, the same “global temperature” may describe many different physical states. For example global sea level may be different so might the size of remaining ice masses. Even these two are composite measures that can have different detailed structure. E.g. Will the Himalayan glaciers have disappeared or even more been shaved off the Greenland Ice Sheet?
To gather together all the characteristics that are used in complex climate models into one number, global average temperature, may be a useful shorthand but it is a fudge. It ignores not only regional temperature variations but also other measures, which are also fudges; but like sea levels, remaining ice mass and ocean heat content, they add more to the climate picture necessary for policy making. And, let’s not forget the problem that looms in many scientists minds: ocean acidification.
Perhaps the “global average temperature” fudge is good for getting political agreements in the hands of skilled political operators but it isn’t enough to drive grown-up policy. A more detailed picture of future possible climates and their consequences is necessary.
As well as more detailed consequences of a changed climate , policy makers should know more about the levers of mitigation that are possible. Here, concepts like carbon dioxide equivalent (CO2e) which conflate several different climate pollutants become concepts that can be confusion: e.g. whether the short lived pollutantsin the CO2e composite should be calibrated for 20, 100 or 500 years.
In Well below 2°C: Mitigation strategies for avoiding dangerous to catastrophic climate changes, Ramanathan et. al discuss three possible groups of levers for mitigating climate change. These are (1)cutting CO2 emissions, (2)cutting short lived climate pollutants and (3)sequestering carbon.
Although these are levers of a sort, mitigations, which are more relevant to policy, could be based on altering consumption:
And lots more.
Changing any of these climate levers independently changes the mix of climate pollutants: a change that cannot be represented by Representative Concentration Pathway because the concentrations come from fixed tables of pollutant concentrations.
It would help if the effects of these climate levers were outputs from climate models – separate effects like sea level rise or Himalayan glacier retreat but driven by measures of consumption like changes in aviation and diet.
Representative Concentration Pathways used in climate models confuse the effects of consumption-based levers. Will there be, any time soon, climate computer models that can have Representative Consumption Pathways which could tell us the effects on climate of halving air travel or changing our diet from beef and lamb to more climate friendly diet?
I am looking forward to seeing large tables describing Representative Consumption Pathways so that the effects of our lifestyles on the climate can be handed over to the scientists to work on.