Carbon emissions in the lifetimes of cars
This is a note about the carbon emissions from new cars during their lifetimes and the relationship with the remaining carbon budget. See also Cars to drive or a planet to live in. A numerical assessment.

The remaining carbon budget
Worldwide greenhouse gas emissions can be added up to form a running total. (The world emits 40 billion tonnes CO2e this year, 39 tonnes next year so that’s 79 billion tonnes in two years and so on.) Then climate models can be used to estimate when this total reaches the point of no return for a ‘global climate disaster’. The amount of greenhouse gases emitted to get to this point is called the remaining carbon budget. The usual use of ‘remaining carbon budget’ specifies the ‘global climate disaster’ in terms of the rise in average global temperature since pre-industrial times, typically 1.5°C or 2.0°C. Here, the budgets for a rise of 1.5°C will be used.
In The UK will be over 4 times over budget, I used a mid-range estimate of the worldwide remaining carbon budget and divided it by the number of people in the world to get a ‘personal remaining carbon budget’. This budget was 57 tonnes of CO2e per person (Note1). The average per capita emissions in the UK was projected to be over four times that budget – up to the time that the decline in UK emissions reaches zero.
Much of this exceedance is caused by the use of cars: vehicles that weigh about a tonne and can travel at 100kph and powered by fossil fuels so it is interesting to look at car emissions.
Emissions from a new car over its lifetime
In his book, How bad are bananas, Mike Berner-Lee gives the carbon emissions from manufacturing and maintaining three different types of car. These carbon emissions are called the ’embodied carbon’ in the cars:
Embodied CO2e in manufacturing and maintaining cars:

The Society of Motor Manufacturers and Traders has said the average age of a car at scrappage in 2015 reached 13.9 years so assume that the sample cars last 13.9 years each. Also assume that each of these cars is driven 11,481 kilometers per year, which is the distance an average car traveled in 2017.
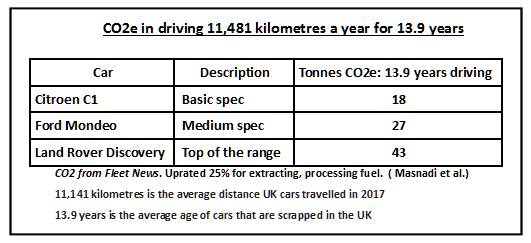
Using the tailpipe emissions given in Fleet News and uprating them by 25% in accordance with Masnadi et al. Global carbon intensity of crude oil production gives this table for CO2e in driving 11,481 kilometres a year for 13.9 years:

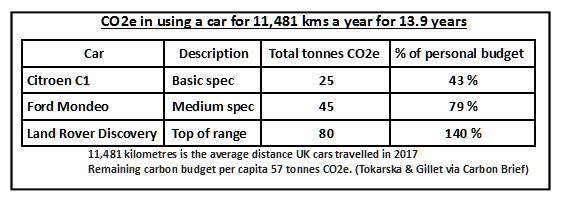
Combining the two tables gives the lifetime emissions of CO2e from manufacture to scrappage:

Cars for sale now and in the immediate future are likely to last their lifetime.
Even a low-carbon Citroen C1 will hit the climate hard during its 13.9 year lifetime using 44% of a personal 1.5°C carbon budget.
Electric cars?
Of course, we are hoping that electricity can be decarbonised to power cars with fewer carbon emissions but manufacture will be carbon intensive for some time. For example in the future it may be possible to make steel using hydrogen rather than coke.
In the medium term, before electricity supplies have been decarbonised and steel is made using hydrogen electric cars will not be much better. Bjorn Lomborg has a point. Electric cars are not low carbon yet:
Note: Carbon dioxide equivalent and the remaining carbon budgets
Most of the cause of Climate Change is emissions of greenhouse gasses from human activity. The most important greenhouse gas is carbon dioxide (CO2) but others, such as methane (CH4) and nitrous oxide (N2O), cause extra warming. To account for these other gasses a composite measure of the gasses, Carbon Dioxide Equivalent (CO2e) is used.
Emissions of CO2 are often made without reference to these other gasses: It is often assumed in national statistics that when a given amount of CO2 is emitted it is accompanied by a proportional amount of other greenhouse gasses. Typically this adds 18% to measures of CO2 alone: e.g. 1 tonne of CO2 is assumed to be accompanied by other greenhouse gasses to add up to 1.18 tonnes of CO2e.
Here, and in The UK will be over 4 times over budget, the remaining carbon budget has been estimated as CO2e but the emissions associated with car use have been calculated for CO2 only. This may mean the climate efffects of car use are worse than stated.
Tweetable image of tables of the carbon emissions of cars:

Postscript 16th May 2019.
Embodied carbon in electric cars
Mike Berners-Lee has estimated that for every £1000 you spend on a new car, its production has caused the emission of 636 Kgs of CO2 – plus some other greenhouse gasses. Today a $US is £0.78 and the cheapest Tesla Model 3 is $35,400. Adding 18% to convert from CO2 makes its embodied carbon 20.6 tonnes CO2e.
Examining Figure 7 in Cleaner Cars from Cradle to Grave from the Union of Concerned Scientist gave the embodied carbon in a Tesla Model S as 15.8 tonnes CO2e.
Carbon Brief’s article, Factcheck: How electric vehicles help to tackle climate change, shows graphs which indicate that the embodied carbon in a Tesla Model 3 is 12.7 tonnes CO2e when using batteries manufactured in the US but 19.5 tonnes CO2e when the batteries are manufactured in Asia.
In Bjorn Lomborg’s video on electric cars (above) he says the embodied CO2 in an electric car is 25,000 lbs. That’s 13.4 tonnes of CO2e.
Postscript 28th May 2019.
A new electric car – a third of your remaining budget.
The graphs in the Carbon Brief article, Factcheck: How electric vehicles help to tackle climate change, gives the in-use emissions from an electric car using UK electricity as 45 gm CO2e/km. This is 7 tonnes CO2e in the average lifetime of a UK car.
With the embodied carbon from the car’s manufacture, the carbon emissions over a lifetime is over 20 tonnes CO2e. That’s about a third of 64 tonnes CO2e, which is the reference target for a remaining personal carbon budget for a 1.5°C.
Postscript 24th March 2020
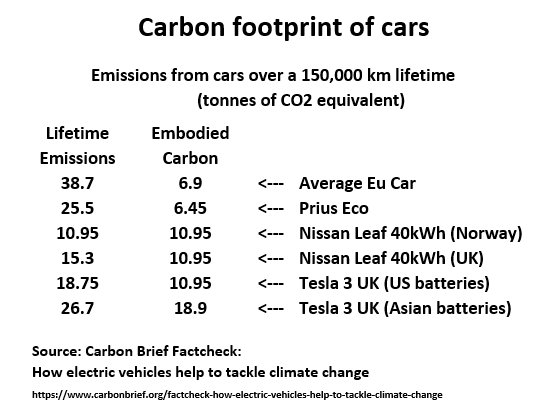
Emission from cars over 150,000 km lifetime
(Calculated from Carbon Brief Article)

Tweets:
The Polestar Battery Electric car from Volvo ” leaves the factory with a 26-tonne carbon footprint.”
