Notes for Climate, Poverty and Planning
#1 CO2 emissions by rich and poor:
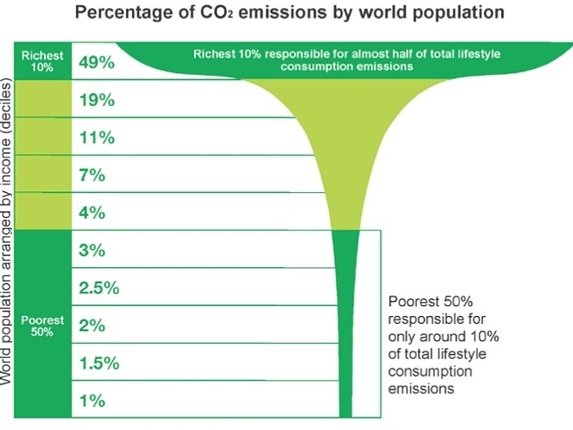
Worldwide:
Richest 10% cause half the emissions.
Poorest 10% cause 1% of the emissions.
#2 Carbon budget for 1.5°
In IPCC’s Table 2.2 of Mitigation Pathways Compatible with 1.5°C in the Context of Sustainable Development, (SR15, 2018) the remaing carbon budget for a 66% chance of keeping below 1.5°C is given as 420 GtCO2 from the beginning of 2018. Subtracting the global CO2 emissions in 2018 of 42 GtCO2 gives 378 GtCO2.
For the period 1997 – 2016, DEFRA have produced figures for UK emissions as both CO2 and CO2e. Over this period the emissions counted as CO2e are 30% higher than those counted as CO2 alone. This is nearly the same in a report by Carbon Market Watch on SR15. Using this 30% increase and an estimate of world population of 7.7 billion gives this table showing a remaining carbon budget, with a 66% chance of remaining under a 1.5°C estimated at 64 tonnes CO2e per person.
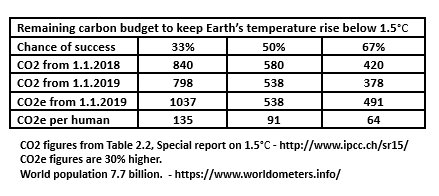
Worldwide:
Budget for 1.5°C is 64 tonnes of CO2 per human
#3 World & UK emissions in 2017
World average: 6.4 tonnes CO2e per person
UK average: 13.0 tonnes CO2e per person
World:
Exhausts the 1.5°C budget in 10 years
UK:
Exhausts the 1.5°C budget in 5 years
#4 Causes of emissions
The poor are the poorest 10% of households
The rich are the richest 10% of households

UK:
Emissions by the rich are much
greater than emissions by the poor.
#5 No new homes for motorists
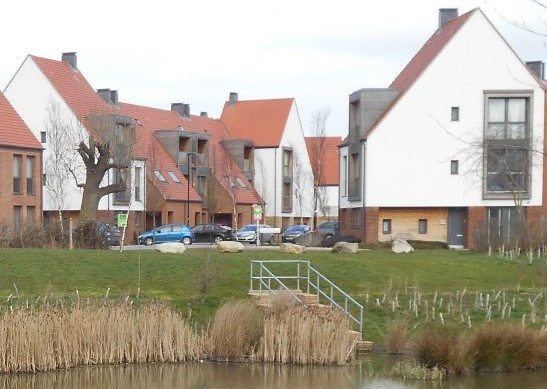
A typical motorist in a new house will have emissions
of 14+ tonnes CO2e a year. Plus an initial 35 tonnes
as a share in the CO2e from building the house.
The new National Planning Policy Framework (NPPF) incorporates
United Nations Resolution 42/187.
This says we must not screw the climate and expect others to pick up the tab. A
typical new development for motorists is for residents with very high emissions.
This transgresses the new NPPF.
UK:
Planning policy bans new homes for motorists.
#6 Housing wealth for rich but …
Rich households are those in the most affluent areas
Poor households are those in the least affluent areas
“Property of the most affluent areas increased by just over eight times the
average income in 2010. Property prices in the least affluent are rose by
a factor of two. However, only 20 per cent of households in the least affluent
areas own their homes. In the most affluent areas this rises to 90 per cent.”
UK housing wealth between 2000 & 2010:
Rich households gained eight times average salary
& poor households paid more rent.
#7 Planning gain in York
Planning gain is the increase in the value
of land when planning permission is granted.
Nationally, it is dwarfed by the increase in the
value of houses but can be surprisingly large.
In the York Local Plan, I estimate planning gain of £2.54 billion.
It’s not paid to York citizens, it goes to lucky landowners.
York’s £2.5 billion planning gain is enough to build:
10 new large hospitals or
150 secondary schools or buy
10,000 new Bentley’s for the Lord Mayor.
#8 Wages in the robot & gig economy
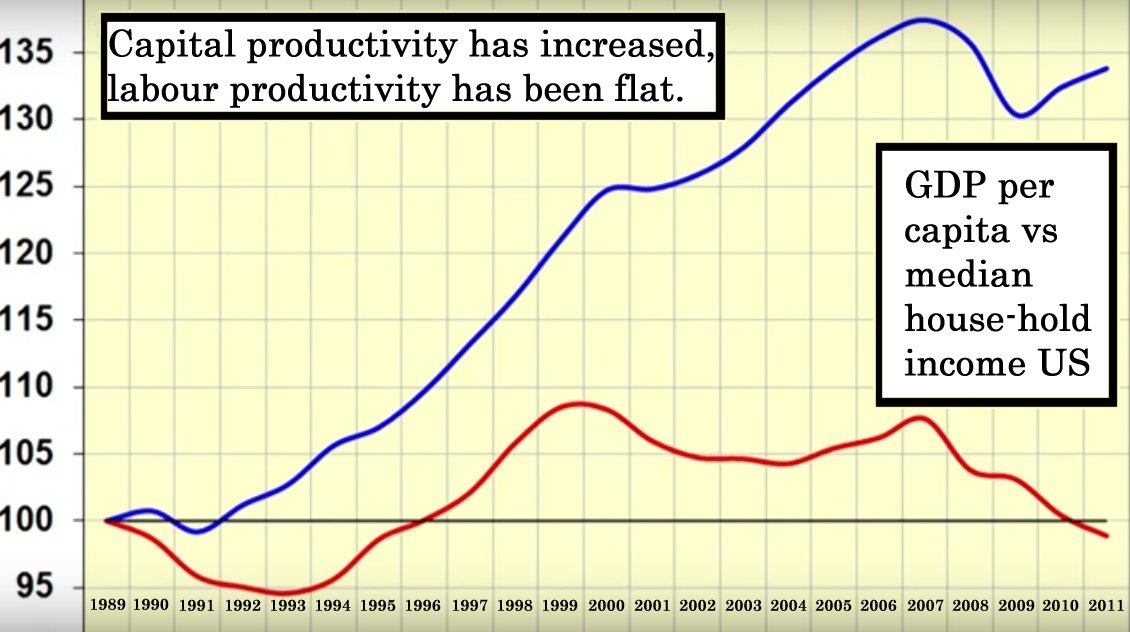
The value of labour is falling and a greater share of GDP goes to unearned income. The rich pollute much more than the poor (notes 1 & 4) so increasingly GDP is paid to those that pollute most.
World and UK:
The polluting rich have unearned income.
The poor have little unearned income.
So tax the polluters to give to the poor.
#9 Is green growth a fantasy?
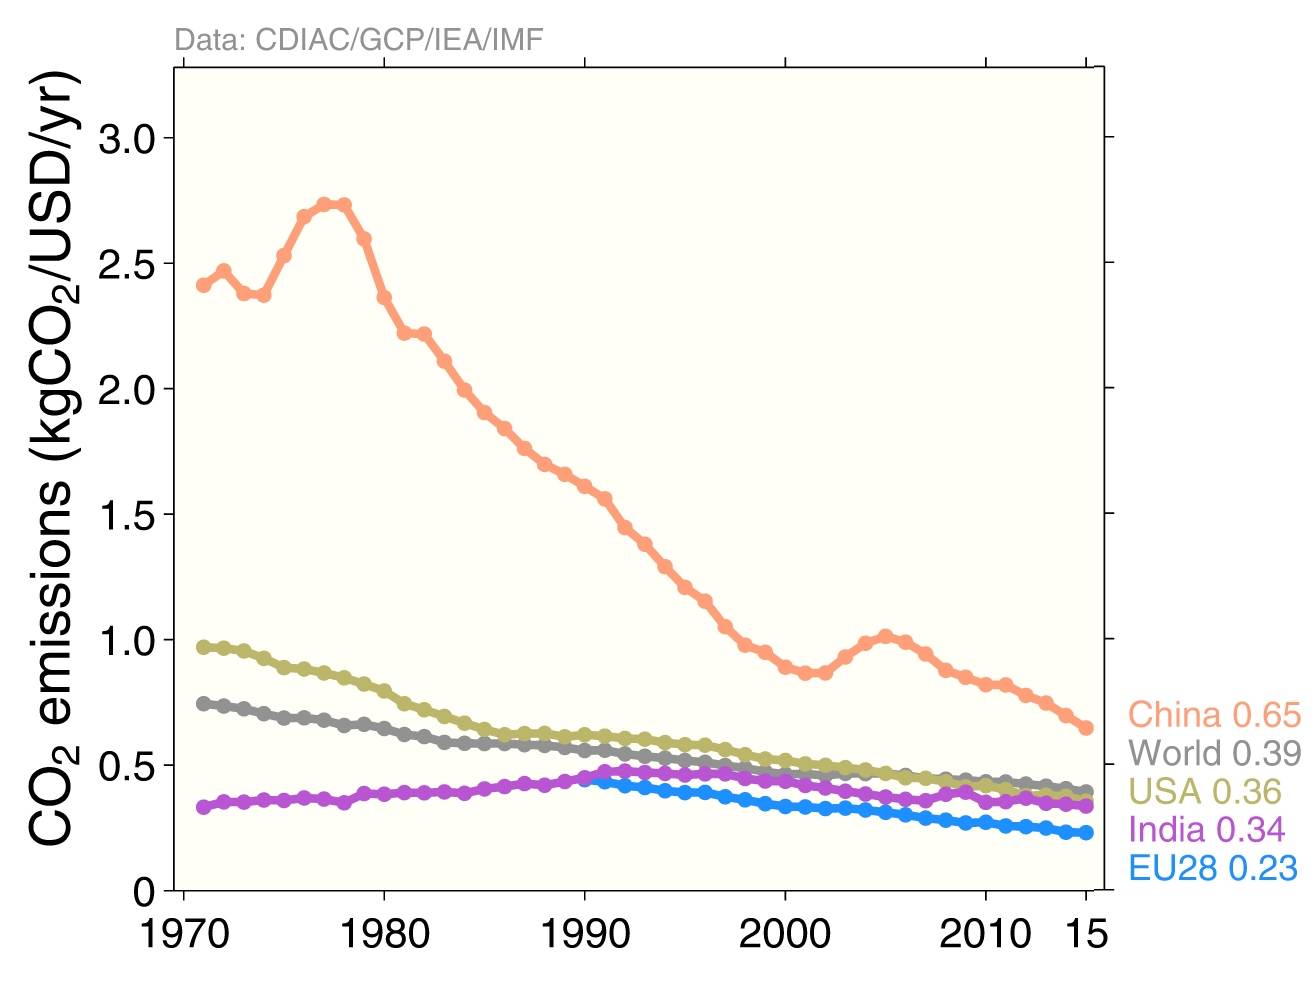
Over the decade to 2015 emission intensity for the world decreased by about 1.9% per year.
To achieve zero carbon by 2050, the rate of decarbonisation needs to be at least 3.2% for
any growth to be possible.
World and UK:
Growth multiplies carbon emissions
so degrowth necessary to get
emissions to fall fast enough.
#10 Atmospheric CO2 still increasing
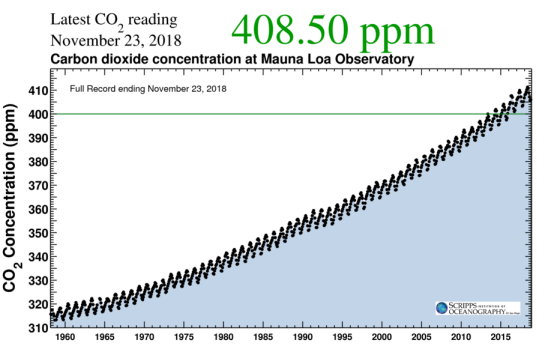
World:
Degrowth necessary.
#11 Costs in car-free cities

In 1992, Carlo Ripa di Meana was the European Commission Environment Commissioner. He called for cities to be free of cars he said he was ready to become car-less, and so should other city dwellers, to prevent Europe’s cities being choked by the internal combustion engine.
He publicised a study showing that it would cost between 2 and 5 times less to live and work in car-free cities because of the savings people could make in not having cars to buy, park, insure and maintain.
World and UK:
Car-free living is very much cheaper.
#12 Garden Cities
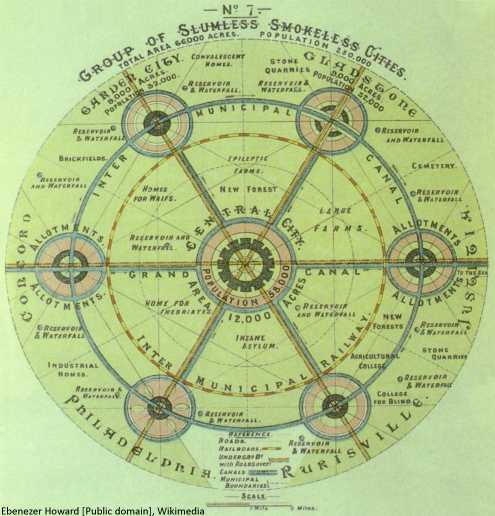
Ebenezer Howard’s Garden Cities were planned towns that combined the benefits of the city and the countryside and avoid the disadvantages of both. They were big enough to have a city’s qualities but small enough to have nearby countryside.
They were separate satellite towns to an existing Central City, with separate areas for separate functions. They were conceived as 2d plans separating functions into geographic separate cells.
As Christopher Alexander later pointed out, separation is much of the problem: Natural cities have a structure where different functions intermingle.
Garden Cities were new starts on a grand scale. Old cities have failed so It was best to start from scratch.
World & UK:
Garden Cities:
Put different functions to separate geographic cells.
Are created separate from existing settlement.
They are start afresh developments on a grand scale.
#13 Climate forcing by economic sectors
The figure below is from the the paper Attribution of climate forcing to economic sectors by Unger et. al. It shows the relative radiative forcing (i.e. global warming) over twenty years, which is attributable to the different activities shown. For this twenty years the forcing by each activity is assumed to be the same as those in the year 2000.
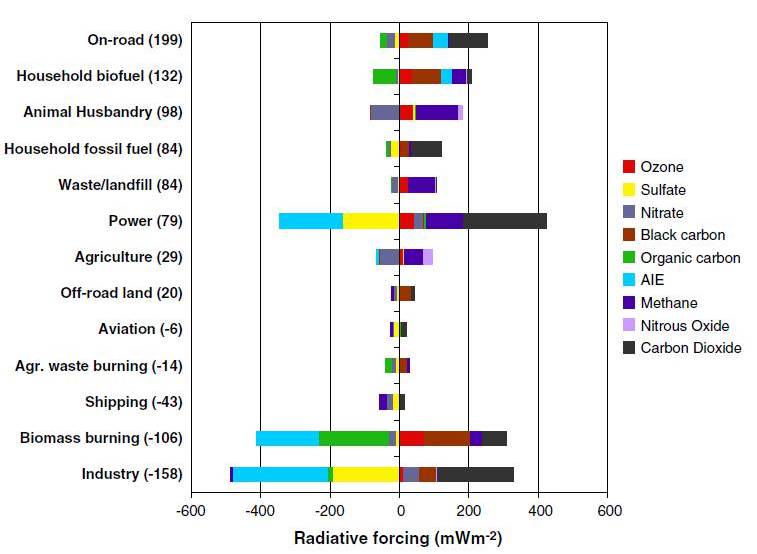
The first surprise is that, in the first twenty years, several activities cool the Earth before they start to warming. The second is that in some cases methane has a cooling effect, although this is minor effect.
… to be continued
To be continued … achieving … degrowth … what the UK can do … references &etc.
